
Business
See other Business Articles
Title: Under George W. Bush, Gas Prices Increased 275 Percent (2001 – 2008)
Source:
Huffington Post
URL Source: http://www.huffingtonpost.com/aaron ... /gop-gas-prices_b_1286787.html
Published: Feb 20, 2012
Author: Aaron Belkin
Post Date: 2012-02-20 12:57:11 by Brian S
Keywords: None
Views: 4782
Comments: 1
"...Our return to Bush-era gas prices is because the economy is rebounding..."
Well, here they go again. With nothing positive to campaign on, GOP strategists have decided to launch a messaging war against President Obama, blaming him for the high price of gasoline. According to the New York Times, the GOP argument is that when Obama took office in 2009, gas was $1.89 per gallon. Today, the price for that same gallon is $3.52. So it must be Obama's fault. Rick Santorum even says that the Democrats "want higher energy prices."
But as I teach my undergraduate students on their first day in class, it is easy to make statistics lie. And you can bet that as the GOP unleashes its attack dogs on the White House, they'll do just that. What they won't tell you, for example, is that under George W. Bush, the price of gasoline increased from $1.60 per gallon when he took office in January 2001 to $4.40 per gallon in July 2008, a jump of 275 percent.
Now it's true that when the economy crashed, the price of gasoline decreased temporarily, in part because the economic meltdown suppressed demand. When Obama took office in January, 2009, the economy was at its low point, and as a result the price of gas was at a low point as well. As the economy improved under Obama's direction, the price of gas returned to its pre-crash baseline.
So the GOP deceptions are based on conveniently forgetting that: (1) the low, 2009 price of gas was simply a reflection of the economic meltdown that they helped cause; (2) before the crash, gas was even more expensive under Bush than it is now; and (3) rising gas prices are a reflection of our economic rebound.
Even worse, the GOP critique glosses over that Republicans have torpedoed every attempt to try to wean the country off of its oil dependency, which is of course the only long-run solution to higher gas prices and global warming.
But here's the rub. The GOP knows full well that if you repeat a lie often enough, you can redefine the truth. The Bush administration sold the public on the Iraq war, after all, by repeating over and over that Saddam Hussein possessed weapons of mass destruction and that he was connected to the 9/11 terrorists, thus implying that he would provide a nuclear weapon to al-Qaeda. As the administration repeated these lies again and again, a growing segment of the public came to believe that Hussein had a role in the 9/11 attacks, and that war was needed to eliminate the threat he posed.
(Even though you're probably familiar with that argument, check out this amazing video which shows just how repetition works. If you're interested in a longer conversation about how progressives can use repetition in a different way, check out chapter 3 of my ebook "How We Won: Progressive Lessons from the Repeal of 'Don't Ask, Don't Tell.'")
So, as the Republicans repeat their misleading claims, we need to saturate the airwaves with a message too. The only difference is that our message doesn't have to be based on deception. We can actually tell the truth: our return to Bush-era gas prices is because the economy is rebounding.
Sure, another pipeline here and offshore rig there will enable us to ignore our addiction for a few more years, but if the Republicans really want to avoid returning to Bush-era gas prices over the long term, they need to support policies that address demand, not just supply. We can't drill our way back to cheap oil.
Post Comment Private Reply Ignore Thread
Top • Page Up • Full Thread • Page Down • Bottom/Latest
#1. To: Related Charts, all (#0)
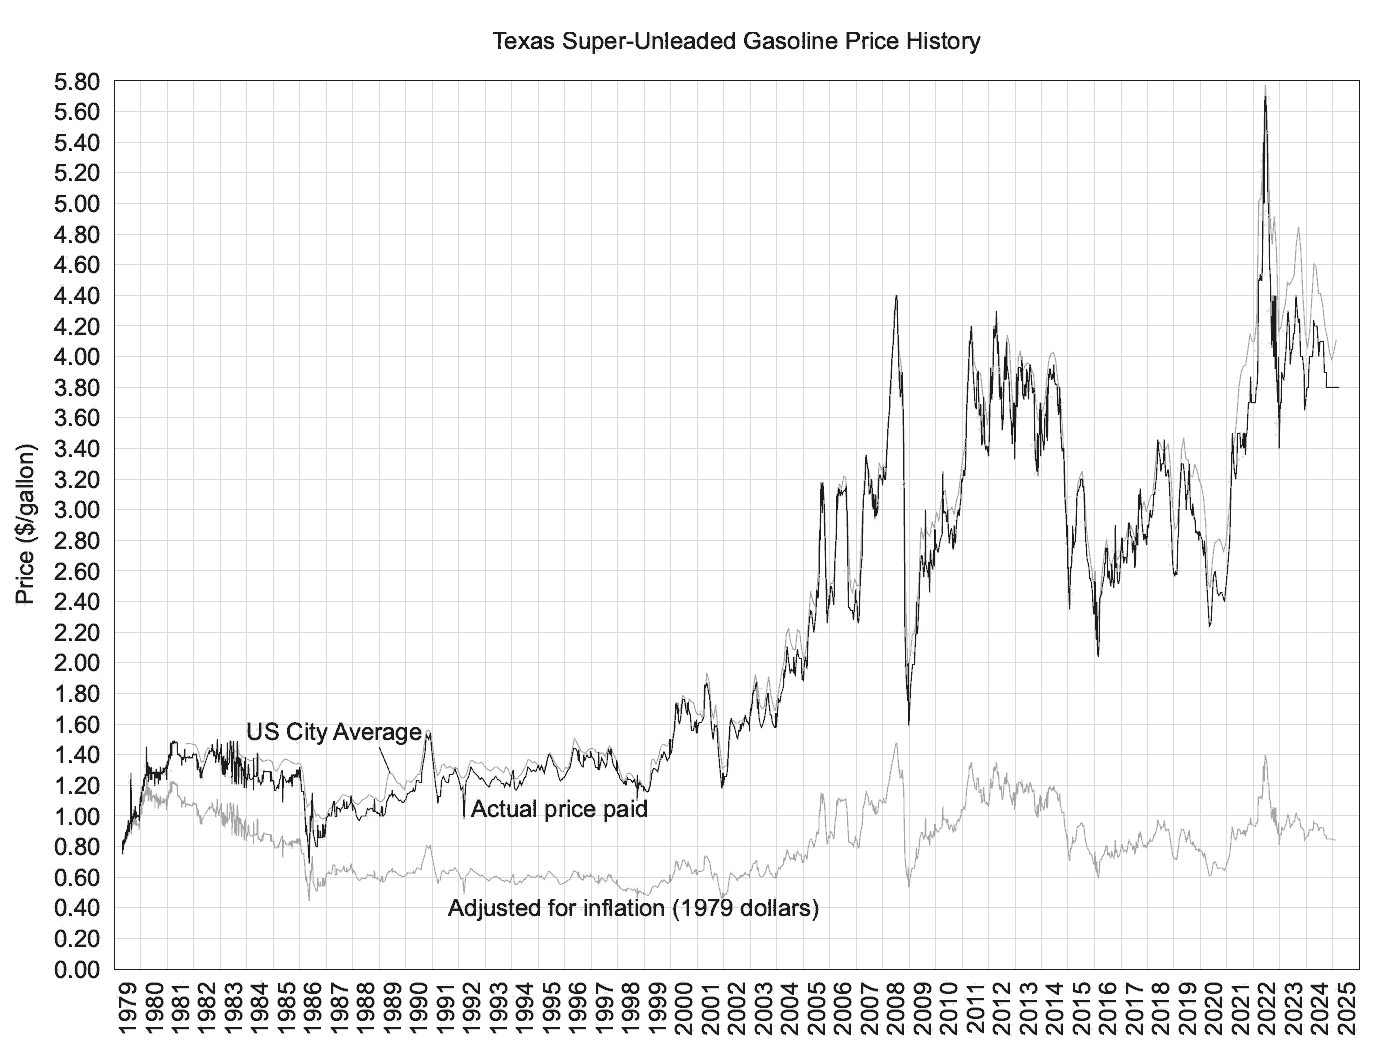
Gasoline Price History
The following plots show how much I paid for each gallon of gas I bought over the past 32 years or so. The data has a somewhat varied pedigree. Most of the purchases from 1979-1982 were in the Rio Vista/Fort Worth, Texas area. From late 1982-1983 was from College Station/Rio Vista about equally. From 1984-1987 was a Rio Vista/College Station/Houston mix and from 1987 on has been mostly Houston with a little Fort Worth thrown in. Just about everything pre-1984 was full service and everything since has been self-serve. Every tank shown was "super" unleaded (92-93 octane).
Three curves are shown on the first plot. The upper, black curve shows the actual price paid for each gallon. The lower curve is the data adjusted for inflation using April, 1979 as the datum. That is, the data in this curve has been adjusted to "April 1979 dollars". The "CPI-All Urban Consumers for all items less energy" was used to adjust the data using monthly average data interpolated to the actual purchase dates. The CPI data is from the U.S. Bureau of Labor Statistics. The third, faint line, shows the average price for the entire U.S., again from the BLS.
The plots contain data from 1216 fill-ups.
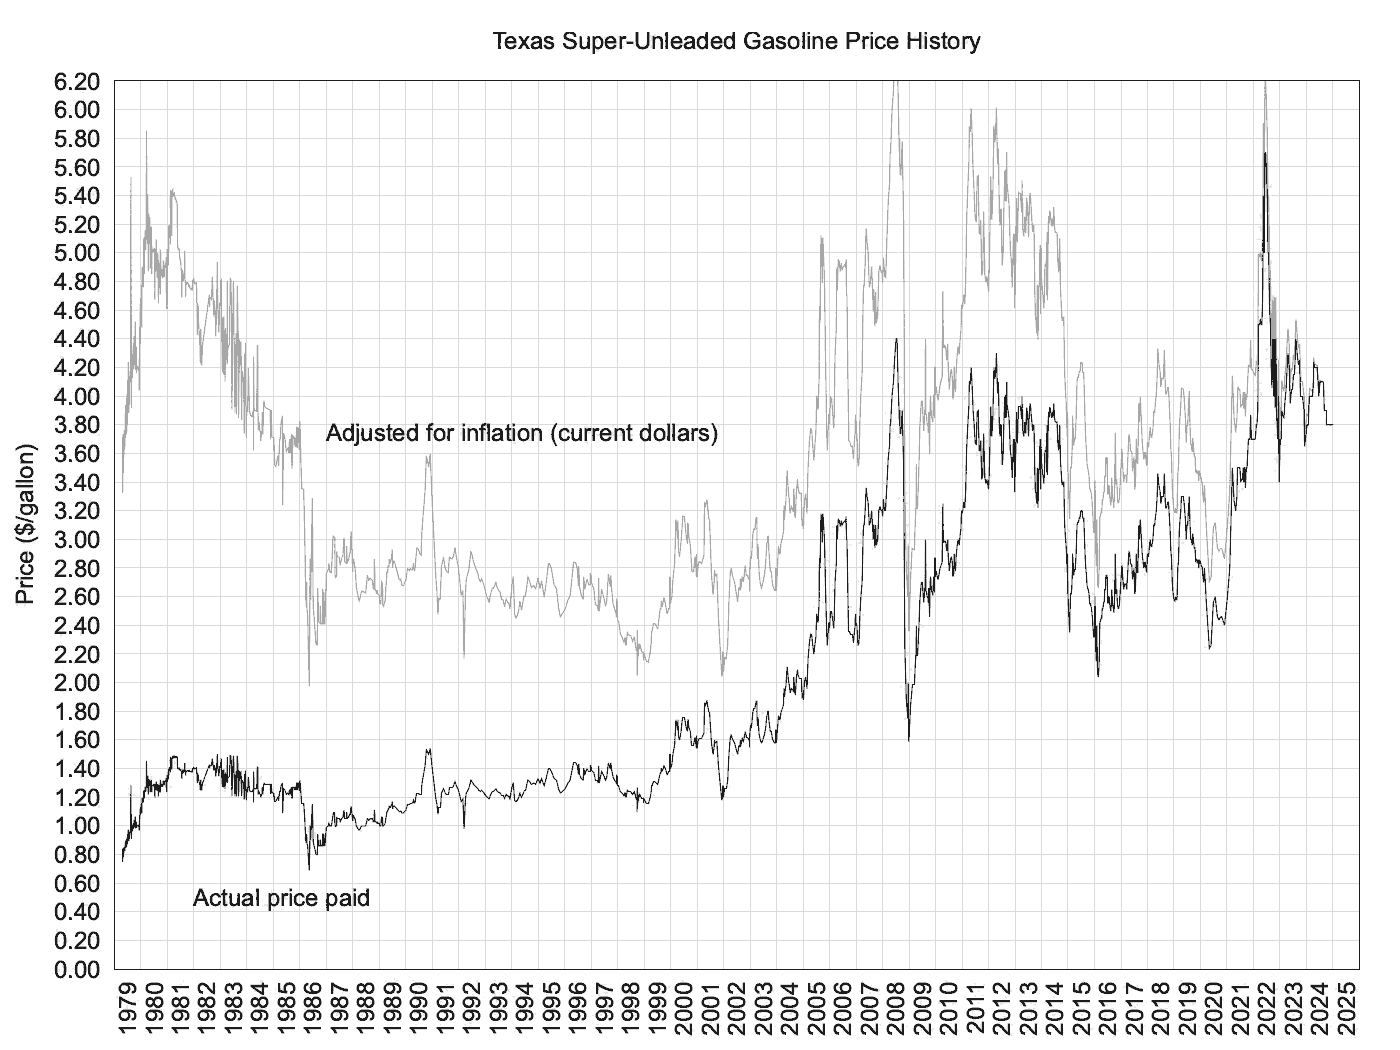
The second plot is similar to the first but here the prices have been adjusted for inflation based on the CPI at the time of the most recent gasoline purchase. This makes it easier to see the inflation adjusted data. For the same reason the US average price data was removed from this plot.
For anyone interested in the raw data...
| Actual price paid: | gasprice.txt, 41,521 Bytes |
|
| Adjusted for inflation: | adjusted.txt, 30,310 Bytes | |
| US City Average: | usa.txt, 6329 Bytes |
Never swear "allegiance" to anything other than the 'right to change your mind'!
![]()
Top • Page Up • Full Thread • Page Down • Bottom/Latest
[Home] [Headlines] [Latest Articles] [Latest Comments] [Post] [Mail] [Sign-in] [Setup] [Help] [Register]