
Business
See other Business Articles
Title: Fox Uses Misleading Employment Charts
Source:
mediamatters.org
URL Source: http://mediamatters.org/blog/201006280019
Published: Jun 30, 2010
Author: Jocelyn Fong
Post Date: 2010-06-30 12:00:14 by Brian S
Keywords: None
Views: 12350
Comments: 24
This morning Fox News' America's Newsroom aired the following chart, which sends a clear message that the job situation has not improved, that in fact things have continued to worsen. Using a straight red line to illustrate the trend, the chart indicates that job loses have been on the rise since December 2007, all the way through this month: The chart claims to show "Job loss by quarter." But it doesn't. (We lost 15 million jobs in the second quarter of 2010!?? Surely, that would have been catastrophic news.) What this defective chart actually displays is the number of unemployed during four random quarters over the past two-and-a-half years. Clearly, Fox got the title of the chart wrong. If they wanted to depict quarterly job losses, they'd have no way of getting around the fact that net job losses ceased at the end of 2009. A chart of the monthly change in jobs since December 2007, from the Bureau of Labor Statistics' Current Employment Statistics survey, looks like this: But I wouldn't let Fox off the hook for just mis-naming its chart. Because even if the chart claimed to represent the number of unemployed, rather than the change in the number of employed, it would still give the false impression of a steady deterioration through June 2010. In reality, their chart should look like this (the level of unemployed from the Current Population Survey): This chart clearly communicates that the jobs situation over the past year differs significantly from the jobs situation during the year before that. And this too can be a misleading depiction of the employment situation, given that the Current Population Survey counts as unemployed only those who are actively seeking work, and not those who have given up finding a job altogether. We can't expect Fox to explain all the nuances of every economic chart they flash on-screen. But I'd hope that we could at least expect the network not to create charts that actively mislead viewers about the state of the economy. And anyway, why would they want to do that? UPDATE: Lest you doubt that Fox News deliberately manipulated its chart to distort the facts, we created our own chart demonstrating that Fox also screwed with the scale of their chart in order to generate that straight red line. Notice on Fox's chart that the first interval on the horizontal axis, from December '07 to September '08 represents 9 months. The second interval, between September '08 and March '09, represents 6 months. And the third interval, from March '09 to June '10, represents 15 months, almost all of Obama's term so far. So the third interval should be two-and-a-half times as long as the second. But in Fox's chart, it's shorter! The effect of this is to flatten out the steep rise in the number of unemployed between September '08 and March '09 (before Obama's policies started taking effect) and to suggest that the increases in unemployment later during Obama's term were more dramatic than they actually were. To get the line straight, Fox also manipulated the scale of the vertical axis. Even if you accept Fox's four random data points --which entirely obscure what has happened since the end of 2009 -- if your scale is accurate, you'd actually get something like this: And again, when you use Fox's data points like this, with no information about the period between March '09 and June '10, you miss the fact that the number of unemployed has essentially stopped rising since the Fall of 2009. UPDATE2: Fox has fixed the name on the chart. They have yet to fix the chart itself. Again, the only way you can get a straight line here is by hugely distorting the scale of both the horizontal and vertical axes. From the June 30 broadcast of America's Newsroom: 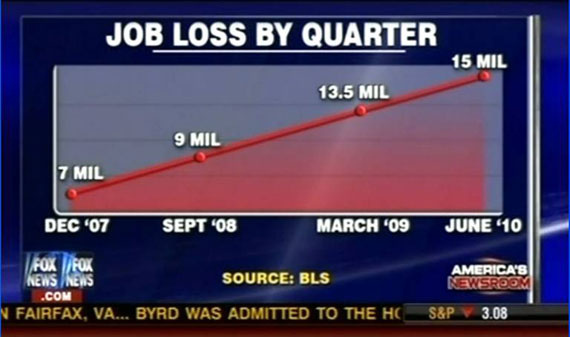


Post Comment Private Reply Ignore Thread
Top • Page Up • Full Thread • Page Down • Bottom/Latest
Begin Trace Mode for Comment # 5.
#5. To: Brian S (#0)
No, wait - let's use Rachel Maddow's charts or Tim Geitner's. Bwaahaa!! If anything, FOX's charts are conservative. The 0bama-Economy is one giant cluster****. People are losing jobs left and right - the numbers are far more staggering than FOX's.
There are no replies to Comment # 5. End Trace Mode for Comment # 5.
Top • Page Up • Full Thread • Page Down • Bottom/LatestEven if you accept Fox's four random data points...
Replies to Comment # 5.
[Home] [Headlines] [Latest Articles] [Latest Comments] [Post] [Mail] [Sign-in] [Setup] [Help] [Register]