
United States News
See other United States News Articles
Title: Immigration's Impact on Republican Political Prospects, 1980 to 2012
Source:
Center for Immigration Studies
URL Source: http://cis.org/immigration-impacts-on-republican-prospects-1980-2012
Published: Apr 9, 2014
Author: James G. Gimpel
Post Date: 2015-10-09 14:26:54 by nativist nationalist
Keywords: None
Views: 383
Comments: 1
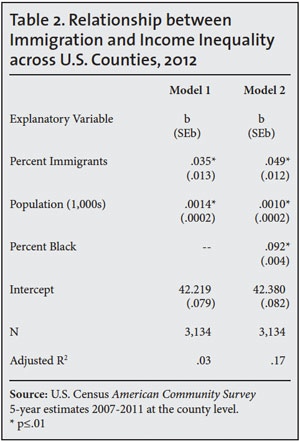
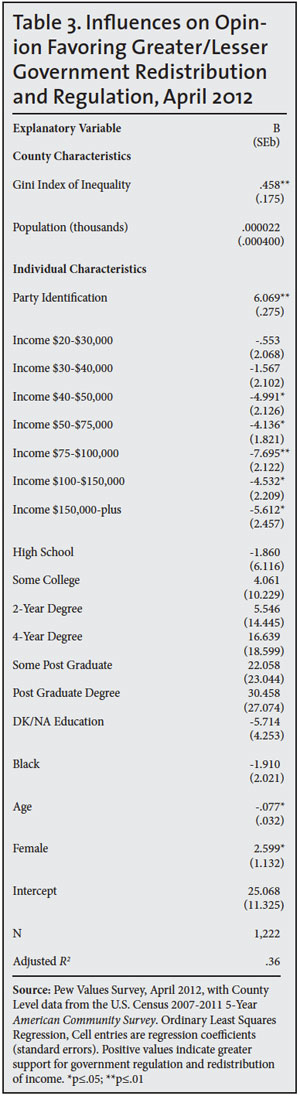
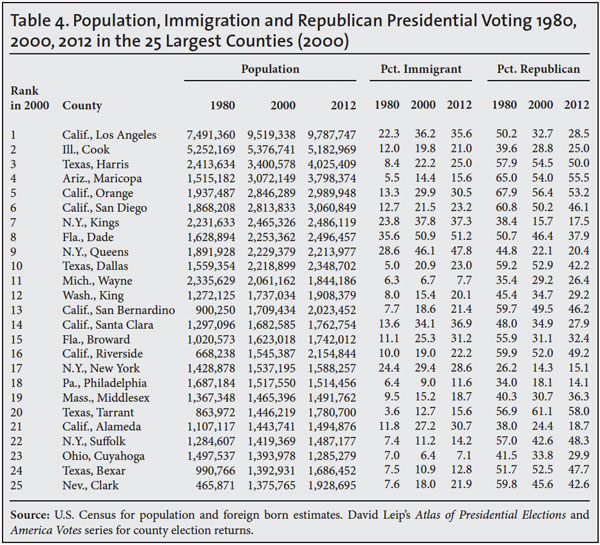
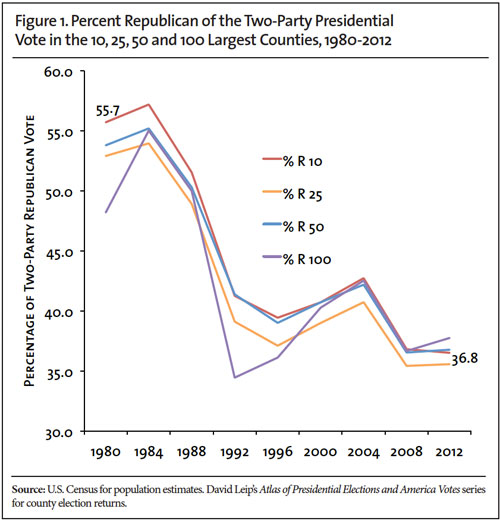
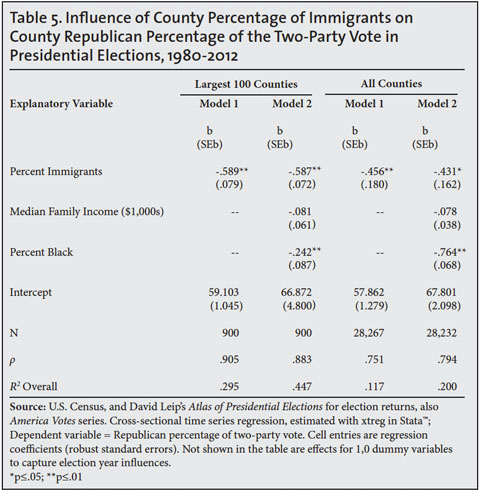
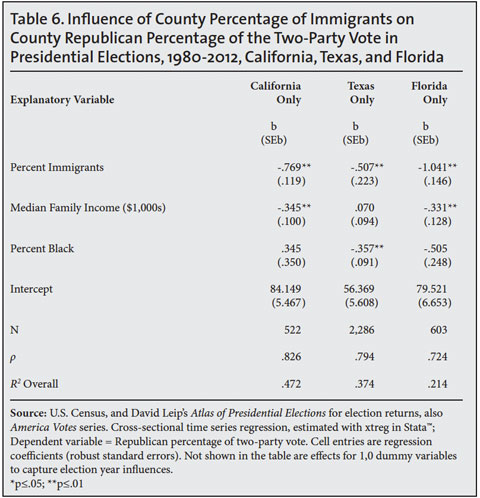
This Backgrounder examines the partisan political implications of large- scale immigration. A comparison of voting patterns in presidential elections across counties over the last three decades shows that mass immigration has caused a steady drop in presidential Republican vote shares, particularly in the nation's largest counties. Each one percentage-point increase in the immigrant share of a large county's population reduces the Republican share of the two-party vote by nearly 0.6 percentage points on average. Three key conclusions emerge from this analysis: First, the enormous flow of legal immigrants in to the country — 29.5 million 1980 to 2012 — has remade and continues to remake the nation's electorate in favor of the Democratic Party. Second, the partisan impact of immigration is relatively uniform throughout the country— from California to Texas to Florida — even though local Republican parties have taken different positions on illegal immigration. The decline does not seem to vary with the local Republican Party's position on illegal immigration. Third, if legal immigration levels remain at the current levels of over one million a year, it will likely continue to undermine Republicans' political prospects moving forward. Further, if the substantial increases in legal immigration in Senate's Gang of Eight bill (S.744) were to become law it would accelerate this process. Conversely, lowering the level of legal immigration in the future would help stem the decline in the Republican vote. Three related findings help explain why immigration reduces the Republican vote: Immigrants, particularly Hispanics and Asians, have policy preferences when it comes to the size and scope of government that are more closely aligned with progressives than with conservatives. As a result, survey data show a two-to-one party identification with Democrats over Republicans. By increasing income inequality and adding to the low-income population (e.g. immigrants and their minor children account for one-fourth of those in poverty and one-third of the uninsured) immigration likely makes all voters more supportive of redistributive policies championed by Democrats to support disadvantaged populations. There is evidence that immigration may cause more Republican-oriented voters to move away from areas of high immigrant settlement leaving behind a more lopsided Democrat majority. Introduction How has the growth of the immigrant population changed the political party leanings in the places immigrants have settled? The answer to this question is of considerable interest to academic specialists, journalists, interest groups, and political parties engaged in the immigration policy debate. If the impact of mass immigration is politically inert there is no reason to be concerned that constituencies will change appreciably by the settlement and naturalization of new arrivals. In that case, immigration might have economic and cultural impacts that should be anticipated, but no one need be concerned about political shifts. On the other hand, if immigration does change the politics of locales, districts, and even entire states, then what might those changes entail? Certainly one important implication will be a resultant public shift toward favoring governmental activism — a belief that government should do more, rather than less. Latino voters, for instance, are presently among the demographic groups that are most strongly behind an activist government. This is undoubtedly because they are, on balance, lower income, and concentrate in areas monopolized by Democratic Party politics into which they are routinely socialized. Observers have witnessed the concurrent surge in California's immigrant population, fueled mostly by the relocation of less educated Mexicans, along with its rising Democratic Party majority, especially in presidential elections.1 Recent studies of Latino party identification have shown that those of Mexican origin and occupying the lower rungs of the socioeconomic ladder are especially likely to identify with the Democratic Party (Alvarez and Garcia-Bedolla 2003, 40). Remarkably, Latinos in California appear to vote overwhelming Democratic even when Republican Latino candidates are on the ballot opposing Anglo Democrats (Michelson 2005). Abel Maldonado (R) lost the Latino vote in the 2010 lieutenant governor's race against San Francisco Mayor Gavin Newsom (D). Earlier efforts, in 1998 and 2002, by the California GOP to nominate Latino candidates for statewide office were also unsuccessful.2 In Texas in 2012, estimates suggested that the Democratic U.S. Senate candidate, Paul Sadler, won the Latino vote over Republican Ted Cruz by a 60-40 percent margin.3 In Nevada, Republican Brian Sandoval was elected governor in 2010, carrying just 33 percent of the Latino vote. It is not surprising, then, that the nation's sustained flow of lower- skilled immigrants, largely from Latin America, has given rise to predictions of an emerging Democratic Party majority by a variety of studious onlookers (Judis and Teixeira 2002; Campbell 2008; Arnoldy 2008; Segura 2012; Taylor, Gonzalez-Barrera, Passel, and Lopez 2012). After all, the propensity for immigrants, and especially Latinos, to be swing voters has been greatly exaggerated by wishful-thinking Republican politicians and business-seeking pollsters who refuse to acknowledge the stability of individual party identification (Green, Palmquist, and Schickler 2002). Entrenched patterns of party loyalty change very slowly, over decades, and are not ordinarily subject to wild swings in response to campaign stimuli. Nevertheless, the rise of a durable Democratic Party dominance in California and elsewhere has more than a single source, and it is always questionable just how much this partisan realignment can be attributed to immigration. Naturalization, Voting, and Political Influence In most locations in the United States, the most direct instrument for the political influence of immigrants is the naturalization process, by which immigrants become citizens and can then vote. As of 2012, the Office of Immigration Statistics estimated that about 8.7 million legal permanent residents are eligible for naturalization, and about 31 percent of those are from Mexico. Not all immigrants naturalize as soon as they are eligible.4 The longer an immigrant resides in the United States, however, the more likely he is to naturalize. Legal permanent residents are becoming citizens at faster rates than in the past. According to recent reports, the share of eligible immigrants choosing to naturalize reached 56 percent in 2011, the highest level in three decades (Taylor, Gonzalez-Barrera, Passel, and Lopez 2012). From 2008 to 2012, nearly four million legal permanent residents became citizens and eligible to vote. About half of those reside in just four states: California, Florida, New York, and Texas.5 Although Latino immigrants have the lowest naturalization rate, their sheer numbers make them a potentially influential population, casting about 6.9 percent of all votes in the 2010 off-year races and 8.4 percent in the 2012 presidential election (Camarota 2011; Camarota 2013). Related research has shown increasing levels of political mobilization among naturalized immigrants, at least in some key states (Barreto 2005). With rising immigration, and faster naturalization rates, the potential for immigrants to change the political landscape of the 10 or so major recipient states is higher than it has been in the past. But for these changes to occur, immigrants must exhibit decidedly different political viewpoints and preferences than the native-born. If immigrants possess or come to acquire the same partisan predispositions as natives and divide their votes in the same way, there is not likely to be much political change resulting from their emergence into the electorate. But recent studies have indicated that the foreign-born, and particularly the large Latino immigrant populations, do not mimic the attitudinal and behavioral tendencies of natives. They have slightly lower participation rates, and they are more Democratic in their party identification and vote preference. Throughout the last decade, for instance, surveys large enough to represent the foreign-born population eligible to vote all showed an undeniably lopsided preference for the Democratic Party. The 2012 Cooperative Congressional Election Study, conducted by YouGov, gauged the partisan preferences of over 2,900 naturalized immigrants, finding 62.5 percent to be Democratic identifiers, 24.6 percent Republican, and 12.9 percent independent (see Table 1).6 Not surprisingly, Mitt Romney's percentage of the Latino vote, just 27 percent, was the lowest share for a Republican presidential candidate since 1996, the year Bob Dole lost badly to Bill Clinton (Lopez and Taylor 2012). In 2008, YouGov polled about 1,600 naturalized citizens and party loyalty also exhibited a lopsided bias: 55 percent Democratic, 31 percent Republican, and 14 percent independent. John McCain won an estimated 31 percent of the Latino vote that year — better than Romney, but not by much. Arguably, Republicans might do better if they nominated more Latino candidates, although that is not entirely clear given that ethnic solidarity is not strong enough to suppress partisan loyalty on anything like a consistent basis. More importantly, among immigrants who are not yet citizens, these same surveys show a similarly unbalanced preference for the Democratic Party (Table 1). With the Democratic bias in immigrant political preference so decisive, it is no surprise that the rise in immigrant populations should directly lead to ever-growing Democratic majorities in the places where immigrants settle, and declining electoral prospects for Republicans. The instrument of this partisan transformation is the directly observable political behavior of the immigrants themselves. Immigration and Public Policy Preferences Knowledge of parties' and candidates' public policy positioning is pretty sparse across most of the electorate (Delli Carpini and Keeter 1996). Many survey research studies indicate that voters do not have crystallized opinions on public policy and that even if they do, they might not be able to correctly identify the views of the candidates. To the extent that immigrant populations have formed opinions based on typically meager policy descriptions, however, they fall largely in line with the views held by liberals in the Democratic Party (Hawley 2012; 2013). In extensive national surveys, major immigrant groups prove to be more liberal than the native- born on matters such as government spending and income redistribution, the government role in healthcare, and government efforts to stimulate the economy. Immigration is but one of a long list of issues on which the foreign-born population is out of sync with the Republican Party (Hawley 2013). On non-fiscal matters, recent surveys suggest that the picture is more mixed, but Hispanics and Asians certainly do not stand out as social conservatives. Hispanic policy views line up so congruently behind the Democrats that prominent Latino scholars say that it is mistaken to consider them swing voters — in fact their Democratic loyalty has been long-standing (De la Garza and Cortina 2007; Segura 2012). Support for Redistributive Policy among Natives The Democratic movement in immigration-receiving locales may be accelerated by the increasing economic inequality that emerges in those places. Census Bureau data indicate that immigration has added significantly to the nation's low-income population. Immigrants and their minor children account for one-fourth of those in poverty and one-third of those without health insurance (Camarota 2012; Rector 2006). McCarty, Poole, and Rosenthal (2008) have described the connection between rising immigration, increasing economic inequality, and greater partisan polarization at the national level in some detail. Large numbers of immigrants arriving after 1965 have been unskilled, earning low wages, and exposing the native poor to wage competition. A cross-sectional analysis of counties in the United States from recent years shows that those with higher percentages of immigrants also score higher on the Gini Index of income inequality, even after controlling for population size and the percentage of African Americans.7 The second model in Table 2 shows that a one point increase in the share of immigrants across counties in 2012 is associated with a 0.05 increase in income inequality — with a single standard deviation increase (Ã=5.6) in the percentage of immigrants associated with a 0.27 increase in the Gini Index. As expected, more populous counties, and those with larger African American population shares, are also more unequal in income, and there is certainly more driving income inequality than immigration. We have not determined that this complicated connection is a causal one, but there is an undeniably positive link between large immigrant populations and income inequality. Moreover, it is from areas of higher income inequality that we find the most support for a robust government with an expansive regulatory and redistributive role in the economy, among all citizens, not just immigrants. Not only do the counties exhibiting high income inequality vote more Democratic in presidential elections, they also produce tides of local opinion supportive of government regulation and policies to tax and redistribute wealth. To test this relationship, we used the Pew Values Survey from April 2012. In that survey, several questions were asked that reveal respondents' support for statements about regulation and government activism. Specifically, Pew researchers asked if respondents completely agreed, mostly agreed, mostly disagreed, or completely disagreed with the following statements: 1. There need to be stricter laws and regulations to protect the environment. 2. It is the responsibility of the government to take care of people who can't take care of themselves. 3. The government should help more needy people even if it means going deeper in debt. 4. Poor people have become too dependent on government assistance programs. Responses to these four items form a single factor or scale score,8 higher values in this case indicating greater approval of increased regulation and redistribution, or opposition to limited government. What explains where respondents score on these questions once they are combined and scaled? Certainly individual party identification, and income matter, as the regression results in Table 3 show. Democrats are far more likely to favor an activist role for government than Republicans — and the difference is about a 42-point gap separating "Strong Democrats" from "Strong Republicans". Similarly, compared to those in the lowest income brackets (<$20,000), those with income above $75,000 are especially likely to oppose an expansive regulatory and redistributive role. Once we include income, education level does not have a statistically significant impact on opinions about government activism. Notably, the Gini Index of income inequality in a county is a statistically significant predictor of support/opposition to liberal government policy among residents of that county, even after accounting for population size. Specifically, a 10-point jump in the degree of income inequality in a county generates a 4.6 percentage-point increase in a resident's favorability toward greater redistribution and regulation (p≤.009). New York City's boroughs and suburbs are perhaps the best example of an area that registers a high degree of inequality coinciding with a climate of politically liberal opinion. On the other end of the continuum, places with higher degrees of income equality, including many rural areas and small towns, are known, ironically, for their support of conservative public policy, opposing greater regulation and redistribution of wealth. In summary, the mechanism that connects high levels of mass immigration to the formation of liberal policy opinion more generally appears to run through the production of greater income inequality in the major metro areas where most immigrants settle. In contrasting locations where the income distribution is narrow, we find greater support for free markets and less support for income redistribution. These are striking findings that merit greater study in order to credibly estimate causal relationships. Immigration and Population Displacement Even when immigrants are slow to naturalize and vote, however, the instrument of political change at the local level can lie in the indirect force of population displacement. If particular populations are pushed out of areas as a consequence of large-scale immigrant flows, this could have the impact of altering the political makeup of districts, states, and regions. A number of labor economists, economic historians, and demographers have documented the prodigious outflow of natives associated with immigrant influx (Frey 1996; Frey and Liaw 1998; Frey, Liaw, Xie, and Carlson 1996; Borjas 1999, Chap 4; Hatton and Williamson 2006, Chap. 14). The exodus is a consequence of downward pressure on wages coupled with soaring housing prices, costs that natives would rather avoid by moving elsewhere. These "crowding out" effects are noticeable only when the volume of immigration is large and one can observe the native response across numerous internal labor markets. For the native out-migration to have a politically realigning effect on the location left behind, the exiting voters have to be predominantly identified with one particular political party. Demographic studies of interregional migration during the 1980s and 1990s suggested that with the exception of elderly migration flows to a few locations, internal migrants were predominantly white, younger, and lower middle, but upwardly mobile. Early evidence from several studies indicated the presence of an independent political leaning among migrants, at least following the move (Brown 1988), with some Republican bias to internal migrants in general (Gimpel and Schuknecht 2001). If internal migration exhibits a Republican bias, and the volume of outflow is sufficiently high, then an ever-greater Democratic majority at the locations left behind — among the non-migrants — would be the outcome. Immigrants, under these circumstances, need not naturalize and vote in order to generate significant electoral change in states, districts, and localities. Enlarging the Majority Party A third possible mechanism for electoral change is that the arrival of immigrants in a location produces larger political majorities because, under population pressure, natives hasten to align themselves with the dominant political organization in these locales. This would occur, for instance, if natives anticipated that the only modicum of competition would be within the dominant party anyway, so there was no point in aligning with the minority party. In most cases, the destinations that immigrants initially aimed for as their inflow intensified in the 1970s already had decided local Democratic majorities. The minority party was not a sufficiently credible local presence in these cities to position itself to take advantage of native disaffection with the results of population pressure. Under such circumstances, political control over the dominant party apparatus in local politics can be settled only within ever more contested primaries, often pitting racial and ethnic groups against one another (Kaufmann 2004). But once the primary is over, the general election outcome is then settled. The main difference between the old politics and the new is in the crowdedness of primaries, and the diversity of groups vying for control. This scenario may fit the experience of large numbers of U.S. cities where the Republican Party is rarely a competitive force, but Democratic Party politics have become increasingly divisive as the white share of the urban electorate has declined. Especially in those cities that have not seen appreciable out-migration by natives, but have seen growth from international sources, it makes sense that the explanation for increasing Democratic electoral majorities lies in the native calculation that fighting within Democratic ranks makes better sense than converting to the hopelessly overmatched out-party. After all, there was little chance that the new immigrant arrivals would elect their own officeholders anytime soon, as that kind of upward political progress would take a generation or more. By this logic, then, natives became a larger share of the Democratic electorate, but immigrants did as well. Both contributed, and are contributing, to the extinction of urban and increasingly suburban Republicans as the immigrant population expands its presence outward from its original central-city destinations (Frey 2006). The Largest Counties Given that the immigrant population is drawn to the nation's largest cities, it is instructive to take a brief look at the 25 largest U.S. counties9 for selected election years (see Table 3).10 A very large share of the total population in these 25 counties was foreign born by 2010 — around 26 percent on average. This compared with just 12 percent back in 1980, showing that the immigrant population has become a far larger presence in these locales, even though it may be diffusing outward from the central cities in these same counties (e.g., Los Angeles County (Los Angeles), Cook County (Chicago)) to their suburbs. While the foreign-born have become more diffuse over time, it was still the case that in 2012, 41 percent lived in just 25 counties. These same counties had only 17 percent of the native-born population. About half of the nation's total foreign-born population is Hispanic and the share in these counties is at least as high. Our central question is whether the rising tide of immigrants in the nation's counties, large and small, has altered their political character. We can certainly see suggestive evidence in support of this notion. Republican presidential voting has declined notably since 1980 in all of the counties in Table 4, and this is not due simply to the differing candidacies (Reagan vs. Bush vs. McCain vs. Romney). To be sure, immigration trends are not the only place to look for an explanation. The smallest losses in GOP support have been in Texas, the largest in California, and yet the immigrant (predominantly Latino) percentage of the population has risen in both. We also have evidence of a drop in GOP support in locations where the immigrant population has not jumped dramatically, such as Cleveland (Cuyahoga County, Ohio) and Detroit (Wayne County, Mich.). Important facts such as these remind us that a rising immigrant voting population is not the only possible source of declining support for Republicans. The flight of natives from these counties and the growing concentration of native-born African Americans may also contribute to the enlargement of local Democratic majorities. Even so, the rise in the number of immigrants flowing into the nation's largest counties has to account for some of the partisan change. Since 1980, the growth has been in the neighborhood of 170 percent for the 100 largest counties in the nation, even though the native-born population increase in these counties collectively has been a small fraction of that figure. And even if only around 38-40 percent of the foreign-born are naturalized and eligible to vote in any given election, their rapid numeric increase coupled with their Democratic loyalty is certain to be a major source of declining GOP electoral prospects. The declining Republican percentage of the two-party presidential vote in the largest counties is exhibited in Figure 1. The drop in support for Republicans is both steady and sharp. In 1980, the largest counties, in the aggregate, gave about half of their two-party vote to the Republicans (ranging from 56 percent for the 10 largest counties, to 48 percent in the 100 largest). The upshot is that these locations, which contain a mixture of central cities and suburbs, were marginal and contested 25-30 years ago, ensconced in the middling deciles of Reagan support in 1980. By 2008 and 2012, however, the Republican two-party vote percentages at these locales hovered between 35 and 37 percent — in some cases a 20-point drop across the intervening election cycles. By the new century, these counties were collectively no longer marginal, but instead safely Democratic. Specific locations where the immigrant population appears to have had a direct impact in diminishing GOP prospects include all of the larger California counties, as well as Maricopa, Ariz. (Phoenix), Kings, N.Y. (Brooklyn), Dallas, Texas (Dallas), and Miami-Dade, Fla. (Miami). All of these locations would be considerably more competitive were it not for the triple-digit growth in the foreign-born proportion of their local populations. Pooled Estimation of Immigration Impact To produce a summary estimate of the amount of impact the surging immigrant population had on Republican vote share in the nation's 100 largest counties, the data for nine elections were combined into a single pooled, cross-sectional data file; 100 counties x 9 elections, or 900 observations total. About 39 percent of all votes cast in the 2012 presidential election were cast in these 100 locations, as they were home to 42 percent of the total U.S. population. The results of the estimation indicate that a one-point increase in the percentage of immigrants across these large counties produced an average 0.59-point drop in the Republican percentage of the vote, controlling only for the distinctive aspects of individual election years. Realizing that the vote may also be influenced by other socioeconomic dynamics, we included controls for median family income and the percentage of African American residents (see Table 5). The impact of the increasing immigrant presence was largely unchanged by including these additional characteristics: a one-point increase in the percentage of immigrants dropped the Republican percentage of the presidential vote by 0.59 percentage points, a striking decline. Another way to gauge the impact is to evaluate the effect of a one-standard- deviation increase in the immigrant population because a single standard deviation is considered a fairly typical degree of change in the distribution. This calculation shows that a one-standard-deviation (Ã=9.9) increase in the percentage of immigrants in the local population drops the GOP vote share by a marked 5.8 percent. In short, the rise in the immigrant population has been a significant force behind the decline in the share of the Republican vote in these urban and suburban centers of national electoral power. Outside of the largest counties, when we incorporate the nation's remaining counties, the immigrant population is likely to be a lesser force driving political change and our estimates of impact are likely to diminish. This is because immigrant populations have been slow to settle outside of major metropolitan areas, so any surge in Democratic voting must be attributable to other causes. The results summarized in the right-hand half of Table 5 indicate that for all locations a 1 percent increase in the immigrant population across these nine election cycles generates a 0.46 percent drop in the Republican vote share, still a substantial effect. Calculations indicate that a single standard deviation (Ã=4.6) increase in the percentage of immigrants locally drops the the Republican vote share by an average of 2 percent, even after we control for the independent impacts of election year, median family income, and the percentage of African American residents. States such as California, New Jersey, Illinois, and New York have lost their competitive status in presidential elections as a consequence of such fundamental demographic change. Florida has moved from a safely Republican state to a perpetual battleground. Texas, too, sits on the threshold of a more competitive politics as Democrats have steadily gained ground in Dallas, Houston, and the state's other large cities. Further out, states such as Georgia may be politically transformed by new immigration settlement patterns. California, Florida, and Texas Compared What is quite remarkable is that, even when we consider Texas by itself, we find that as the immigrant population has grown across its 254 counties, the Republican vote share has declined from where it stood 30 years ago. Separate estimates for California, Florida, and Texas appear in Table 6. For Texas, these figures show that for every 1 percent increase in the immigrant presence in a county, the Republican vote share dropped by 0.51 points, which is somewhat higher than the impact nationally. A one standard deviation (Ã=6.2) increase in the percentage of immigrants taking up residence in Texas counties translates into a three-point drop in Republican Party prospects, controlling for median family income and the percentage who are black. Contrary to conventional wisdom, immigration is precisely why the GOP has lost so much ground in the most heavily Latino areas of South Texas, as well as in the larger urban counties. For California, the story is somewhat different. Yes, the drop in Republican presidential voting has followed on the heels of the immigrant influx, a 1 percent increase in the immigrant concentration drops the GOP vote share by about 0.77 points (Ã=9.3), producing a seven-point drop in Republican percentage with a single standard deviation increase in the immigrant presence). But the impact of rising income drops the GOP vote share as well, as the wealthy coastal counties have become profoundly Democratic since the early 1980s. In Texas, rising affluence is neither a positive nor negative force on the vote — the estimates show no statistically significant impact. In California, however, immigration coupled with growing affluence have combined to put the state out of Republican political reach in national elections.11 Florida seems to be following California's example, with a single standard deviation increase (Ã=7.3) in the immigrant percentage yielding a 7.6-point decline in the Republican share of the presidential vote from 1980 to 2012. As in California, rising median family income across counties and over time is also associated with declining GOP prospects. Conclusions Using standard statistical methods, this research has estimated the impact of the rising percentage of immigrants across U.S. counties on Republican presidential voting in the presidential elections from 1980 to 2012. The conclusion is inescapable. As the immigrant population has grown, Republican electoral prospects have dimmed, even after controlling for alternative explanations of GOP performance. A typical drop in Republican support in a large metro area county is about six percentage points. In practical terms, an urban county that cast 49 percent of its vote for the Republican candidate in 1980 could be expected to drop to 43 percent by 2012, just as a consequence of a rising immigrant population. Across all U.S. counties, including the many smaller counties, the estimated effect of immigration is to drop Republican vote share about two percentage points. Even in seemingly remote locations with negligible immigrant populations, the effect is sufficient to move a 51 percent county to a 49 percent county. Aggregated over the large number of counties and viewed through the template of the Electoral College's winner-take-all system of elections, the impact of immigration is easily sufficient, by itself, to decide upcoming presidential elections. Ironically, past Republican votes in Congress in favor of a more generous immigration policy have unquestionably bolstered local Democratic majorities, and succeeded in stamping out Republican prospects in once politically competitive locales. This is because Republicans have not converted the legions of Democratic-leaning Latinos who constitute a large share of the immigrant population. Nor can they be expected to win over many Latinos given their weak institutional presence in the locations where new arrivals typically settle. The hope for Republican success with immigrant voters lies mainly with the upward mobility and prosperity of Latinos, Asians and others, something that will occur only with great difficulty given current levels of low-skill, wage-limiting immigration. Republicans are right to want to attract Latino voters. They are indisputably a growing share of the population and the electorate. But expanding the flow of low-skilled immigrants into an economy ill-suited to promote their upward mobility will be counterproductive given the evidence presented here. At the same time, Republican reservations about higher immigration levels can be too easily typecast as racist and xenophobic. This is because the party's elites have failed to deliver a clear message that they want a pro-immigrant policy of reduced immigration and that these two goals are complementary. Such a policy will also prove to be the best means moving immigrants toward the middle and upper income status that will promote their geographic and political mobility. 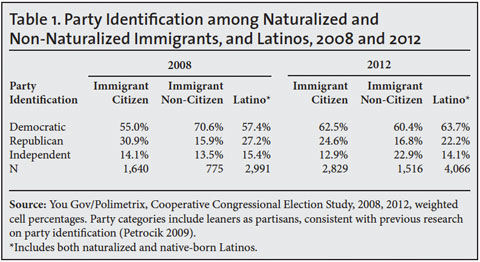
Post Comment Private Reply Ignore Thread
Top • Page Up • Full Thread • Page Down • Bottom/Latest
#1. To: nativist nationalist (#0)
Well, no shit Sherlock!! The Republican party, just like the nation, will go the way of the Roman Empire, into the dustbin of history, and will no longer exist. I can think of many statements I could make, but would probably only land me in jail. I will only say FU to all the demonrats, Jebby Bush's, etc. that have propagated all of this open borders crap. I am certain they will all burn in hell for ever & ever. What a hell of a mess we are leaving our children. This country is over. Si vis pacem, para bellum Those who beat their swords into plowshares will plow for those who don't Rebellion to tyrants is obedience to God.
" the enormous flow of legal immigrants in to the country — 29.5 million 1980 to 2012 — has remade and continues to remake the nation's electorate in favor of the Democratic Party. "
Top • Page Up • Full Thread • Page Down • Bottom/Latest
[Home] [Headlines] [Latest Articles] [Latest Comments] [Post] [Mail] [Sign-in] [Setup] [Help] [Register]